-
Click the Signal button
 on the toolbar and select "Show signal".
- Press enter key.
- Right-click and select "Show signal" from the context menu.
To display the signal waveform, do one of the following operations.
on the toolbar and select "Show signal".
If you want to display multiple records in a window, use the method 2.
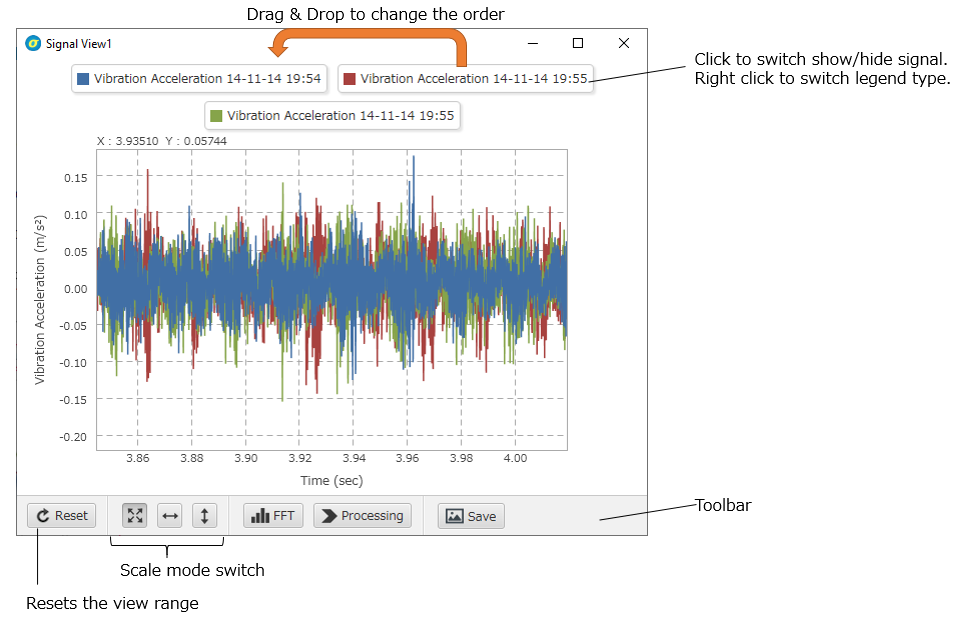
 on the toolbar
or right-click and select "Reset Range" from the context menu.
on the toolbar
or right-click and select "Reset Range" from the context menu.
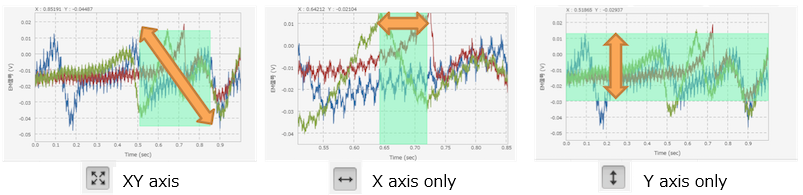
The zoom mode switch button 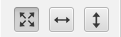 allows you to change the scaling direction to XY axis, X axis only, or Y axis only.
Right-click on the signal view and select "Range setting" from the context menu. Enter values in the range setting dialog and click OK to update the range.
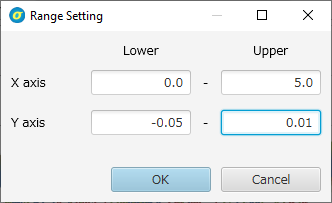
You do not need to enter all fields. Blank fields will use the current state.
When you have multiple signal views open, you can apply the view range of one window to another.
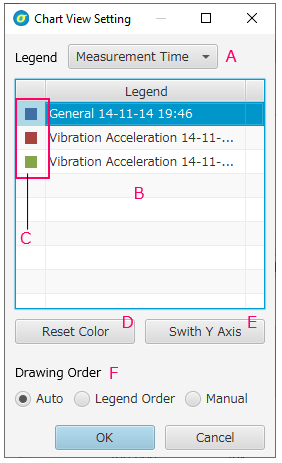
Right-click in the signal view area and select "Chart view setting" from the context menu.
The settings here apply to only a currently displayed chart. If you want to change the global color settings, please set it from Graph Preferences.
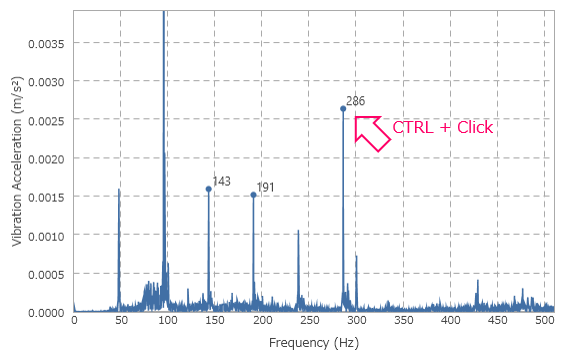
In the frequency spectrum view, CTRL+click adds a frequency marker to the peak near the cursor. To remove the marker, CTRL+click again.
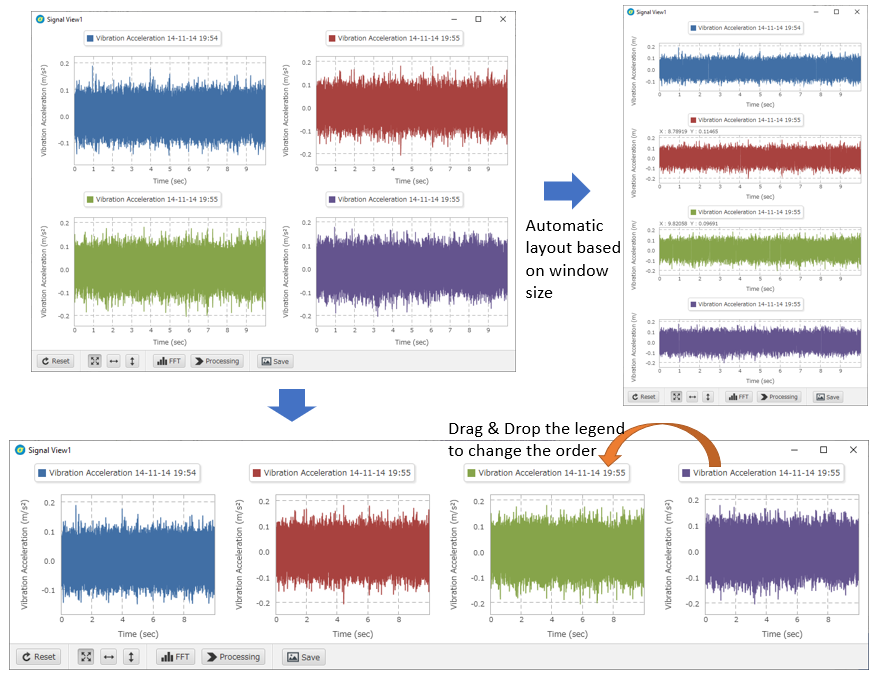
When multiple signals displayed in one chart, right-click and select "Individula chart" from the context menu to display each signal in its own chart. If you resize the window, the layout will be automatically adjusted. To draw them in a single chart again, right-click and select "Gather Charts" from the context menu. If records contains more than three different physical quantities, only individual chart is possible.
Operations specific to individual display
The operation is the same as copying and pasting the view range, but in the case of individual chart, the chart where the cursor is currently placed will be the target of copy and paste of the range.
By drag and dropping the legend to another chart area, you can change the order of the charts.
Click the FFT button  to switch between the frequency spectrum and time waveform.
Only when the frequency spectrum is being displayed, the logarithmic switch button
to switch between the frequency spectrum and time waveform.
Only when the frequency spectrum is being displayed, the logarithmic switch button  appears on the toolbar,
allowing you to switch the horizontal axis to logarithmic scale.
appears on the toolbar,
allowing you to switch the horizontal axis to logarithmic scale.
In Sigma, the FFT is performed using all the time region of waveform in one record. If you want to display the frequency spectrum of only a specific time region of one record, clip the signal (see Clipping signals) and press the FFT button.
By right-clicking in the chart view and select "Trim record", you can trim the waveform into the currently displayed time range and display it in a separate window. This is used when you want to display the frequency spectrum of a specific time range, or when you want to save only a specific time range as a record.
Just trimming a signal does not save it as a separate record. To save it as a separate record, select Save as new record from the context menu.
The Processing button  allow you to perform various types of signal processing.
The signal processing is overlaid each time it is executed.
If you want to return to the original signal, select "Restore" from the Processing button.
allow you to perform various types of signal processing.
The signal processing is overlaid each time it is executed.
If you want to return to the original signal, select "Restore" from the Processing button.
| Band pass filter | Leaving only the specified frequency band. |
| Band stop filter | Removing only the specified frequency band. |
| Envelope | Simple envelope processing by low-pass filtering after taking absolute values. |
| Autocorrelation coefficient | Correlation coefficient with own signal shifted in time |
To save the processed signal, execute Save as new record.
To save the waveform as a separate record after trimming or signal processing, right-click in the chart view and select "Save as new record" from the context menu. Enter the information in the dialog box that appears and click OK to save the record.
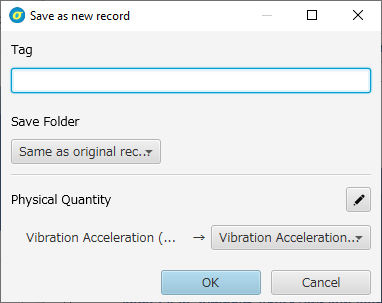
An arbitrary string to be saved as a tag for the record to be saved.
Select from "Same as original record" or "Loaded data"
Use to change the physical quantity
To save the currently displayed signal as an image,
click the Save button  or right-click on the signal view and select "Save Image" from the context menu.
The first time you click on the Save button,
a dialog box will appear asking you to select a folder to save the image.
If you want to change the save folder, select "Save image at..." from the context menu.
or right-click on the signal view and select "Save Image" from the context menu.
The first time you click on the Save button,
a dialog box will appear asking you to select a folder to save the image.
If you want to change the save folder, select "Save image at..." from the context menu.
To copy the currently displayed signal image to the clipboard, press CTRL+C while the signal view is in the foreground, or right-click and select "Copy Image" from the context menu. The copied image can then be pasted into an application such as PowerPoint.
A raw waveform of single record can be divided into multiple sections, each of which can be saved as a separate record. There are two ways to split a record: using "Simple Split" or creating a "Record Split Setting" and use it.
Splitting a record does not change the original record. Deleting the original record after splitting will have no effect on the splitted record.
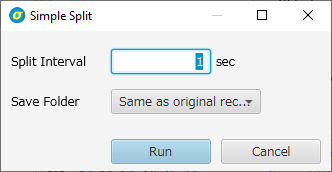
The simple split allows you to split records at regular time intervals entered in the dialog.
For details on how to execute this, see Execute record splitting.
The record split setting allows you to specify a more complex splitting scheme. It is also useful when the same splitting scheme is used many times.
To create or edit a record split setting, select "Record Split Setting" from the Setting button  to open the record split setting list window.
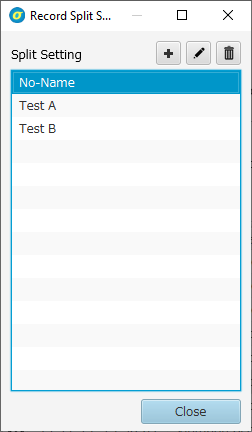
To create a new record split setting, click the Add button  to open the Split setting edit window.
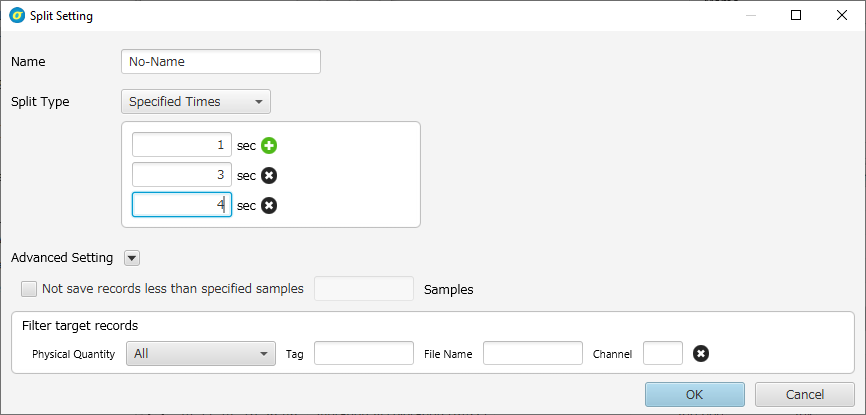
You can select from the following three split schemes.
There are two ways to execute record splitting.
 on the toolbar,
and select the split setting you want to use from "Split Records".
You can select "Simple Split" or user-defined setting.
on the toolbar,
and select the split setting you want to use from "Split Records".
You can select "Simple Split" or user-defined setting.With one or more records selected in the record list, right-click and select "Split records" from the context menu, then select the split setting you want to use.
The spectrogram view shows the result of the short time Fourier transform of the signal as a contour graph with time as the horizontal axis and frequency as the vertical axis. In Sigma, the absolute value of the amplitude of each frequency component is used. To display the spectrogram, do one of the following with selecting records.
on the toolbar and select "Show Spectrogram"
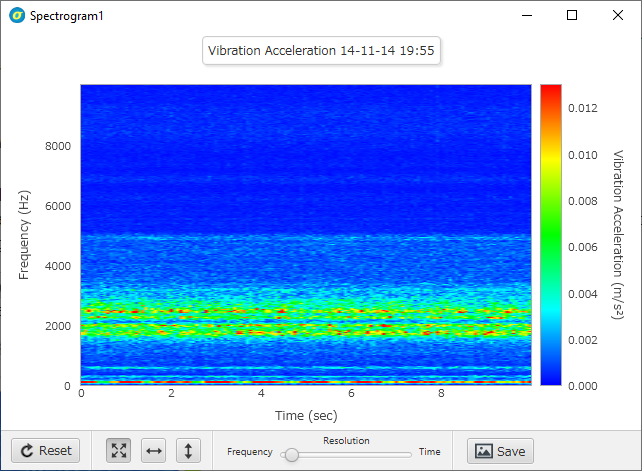
This slider is used to change the frequency and time resolution. The higher the frequency resolution, the lower the time resolution, and vice versa. To specify the resolution in numerical values, right-click on the spectrogram view and select "Chart View Setting".
If you have multiple spectrogram views open, you can apply the settings of one view (contour level, frequency resolution) to another view.
Right-click on the spectrogram view you want to copy, and select "Copy Spectrogram Setting" from the context menu (or press Alt + C).
Right-click on the spectrogram view to be pasted, and select "Paste Spectrogram Setting" from the context menu. (or press Alt + V)
Mouse operations such as scaling, panning, operations on the legend, copying and pasting the view range, and saving images are all common to the signal view.
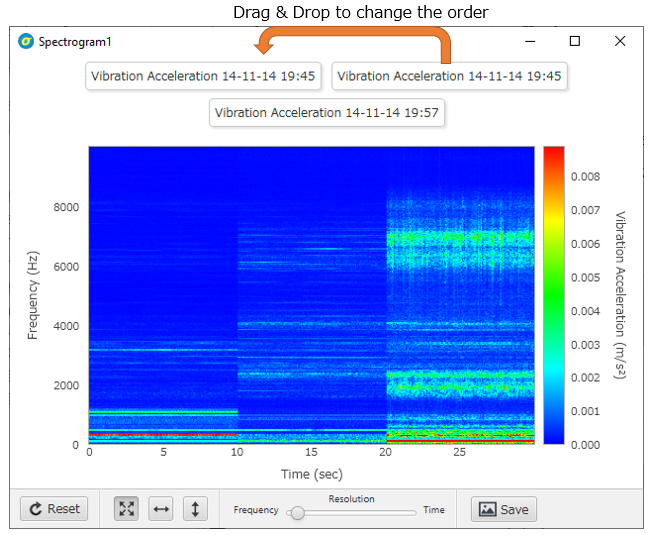
When showing the spectrogram with multple records selected, they will be concatenated in the time direction. To change the order, drag and drop the legend.
Right-click on the spectrogram view and select "Chart View Setting" to configure the detailed settings for the spectrogram view.
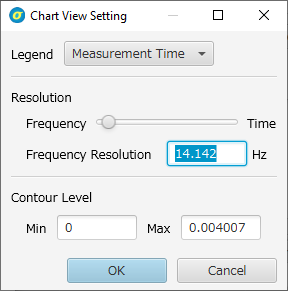
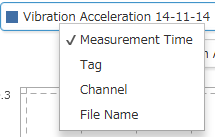
Selects the legend type
Change the resolution by moving the slider or entering a numerical value for the frequency resolution. The range that can be changed is limited by the sampling rate and sampling duration of the record.
Enter the minimum and maximum values. (By default, the value is calculated automatically.)
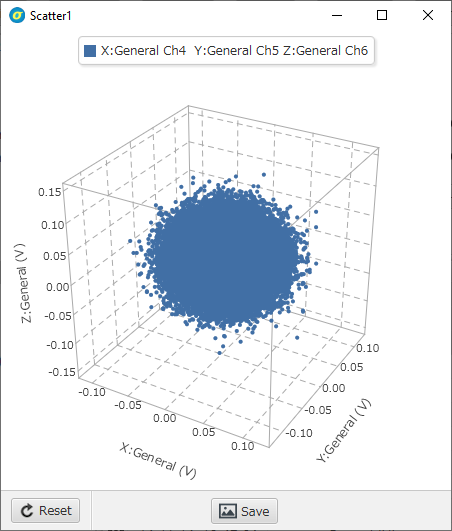
Plots the raw waveforms of multiple records on a two-dimensional plane or in three-dimensional space.
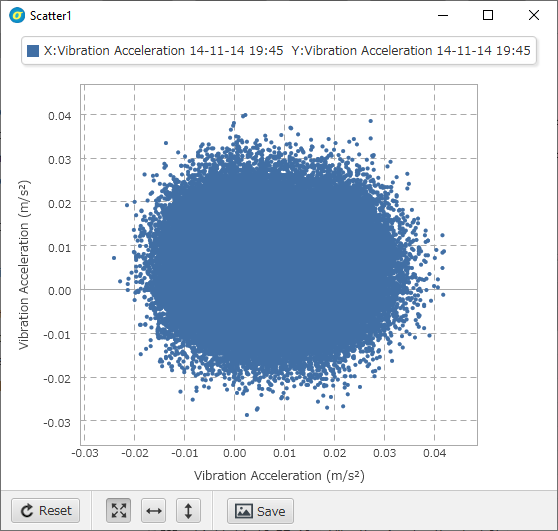
Plots the raw waveform values of two records on the XY plane, with the value of the first record as X and the value of the second record as Y. The difference in sampling rate between the two records is not taken into account, and the n-th point of each raw waveform becomes a pair and a point on the plane. If the number of samples in the two records is different, it can still be displayed, but in that case, the samples will be plotted up to the point that a pair can be created.
Plots the raw waveform values of the three records in XYZ space, with the value of the first record as X, the value of the second record as Y, and the value of the third record as Z. Sampling rate and number of samples are handled in the same way as for 2D plots.
To display a scatter plot view, select two records (or records in multiples of two) for a 2-D plot, or three records (or records in multiples of three) for a 3-D plot, and then do one of the following
on the toolbar and select "Scatter".The selected records will be paired in the order in which they are displayed in the record list. Example: If you have selected records A, B, C, and D, records A and B will be the first series, and records C and D will be the second series.
To unify the view range of X-axis and Y-axis, right-click on the scatter plot view and select "Unify all axes range" from the context menu.
Mouse operations such as scaling, panning, operations on the legend, copying and pasting the view range, and saving images are all common to the signal view.
Mouse operation
Pannign and rectangel zoom are not supported.