The Sigma AI module can apply machine learning to records to perform more advanced anomaly detection and trend monitoring.
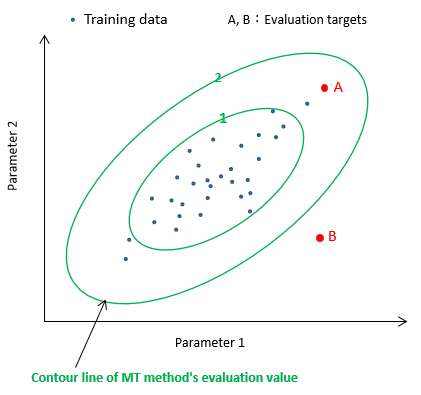
The Sigma AI module learns the reference record set (normal record set), and evaluates the differences between the reference record set and the target data using the MT method. The MT method takes into account the variations and correlations of the parameters that make up the reference data set, thus enabling more advanced anomaly detection compared to simple one-parameter threshold monitoring.
The figure on the left shows an example where one sample has two parameters and they are positively correlated. The green ellipse is the contour line of the MT method's evaluation value (how far away from the reference data set it is). Since the contour line is an ellipse reflecting the correlation (angle) and variability of the two parameters, we can determine that the degree of anomaly is greater in B than in A. This kind of evaluation is not possible with individual threshold monitoring of each parameter.
AI model setting is a setting for calculating a AI model,
defining which records will be used as training data, what features will be used, etc.
To create AI model settings, press the Setting button  on the toolbar and select "AI Model Settings".
Click the "Add" button  to open the AI model settings editing window
and configure the settings. 30 AI model settings can be created at maximum.
to open the AI model settings editing window
and configure the settings. 30 AI model settings can be created at maximum.
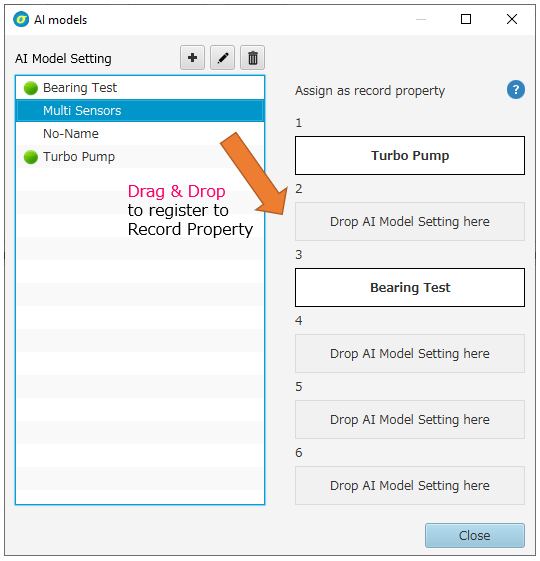
By drag and dropping the created AI model setting into the "Record Property" slots, the evaluation results by the model can be stored in Sigma as information that is attached to each record. There are six "Record Property" slots, which are global settings for all records. The evaluation of each record by the registered AI model can be performed by clicking the Calc button on the toolbar and select "Calculate Record Properties". The evaluation results can be plotted in the trend view window.
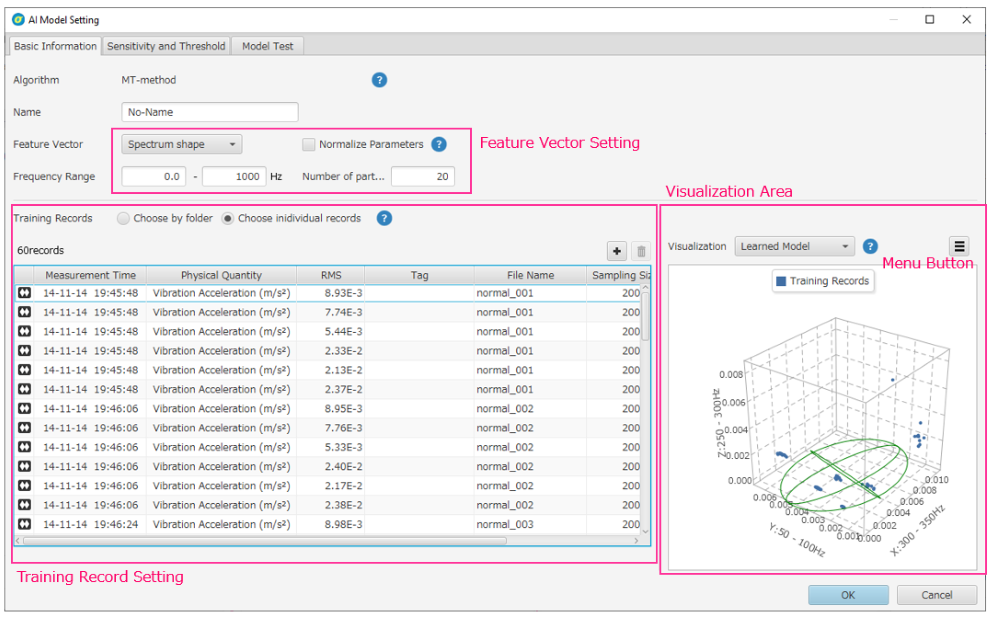
A data array (vector) representing the features of a single sample, which is used in training and evaluation, is called a "feature vector". A typical record of Sigma is assumed to be a raw waveform with a relatively high sampling rate, such as a vibration waveform, however the raw waveform itself is not suitable to be treated as a feature vector because it is too much data. How to create feature vectors from records can be selected from the following three options.
A frequency spectrum of the raw waveform of one record is used as a feature vector. This is effective when you want to detect abnormalities by changes in the frequency spectrum. The following items need to be specified.
When the visualization type in the visualization area is set to "Feature Vector" and selecting a record in the training records list, the shape of the frequency spectrum will be displayed in the visualization area.
The combination of multiple features of a single record becomes a feature vector. You can use not only preset features such as RMS or MEAN, but also user-defined features.

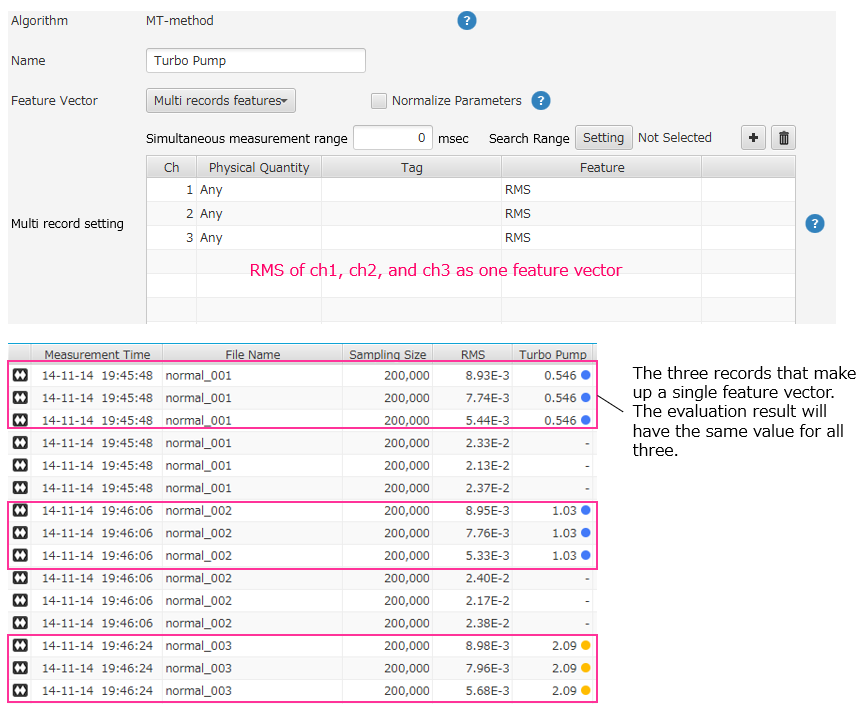
The combination of feature values of multiple records becomes a feature vector. It is assumed that records of multiple sensors measured simultaneously are used. It is effective for detecting abnormalities caused by a breach in the relationship between multiple sensors that are linked. It is possible to detect abnormalities based on changes in the relationship between multiple sensors
By selecting "Multiple Record Features" as the feature vector,
the Multi-record setting table will be displayed.
Multiple simultaneous measurement records used to create feature vectors are dynamically searched in Sigma
according to the measurement date and time and the rules defined here.
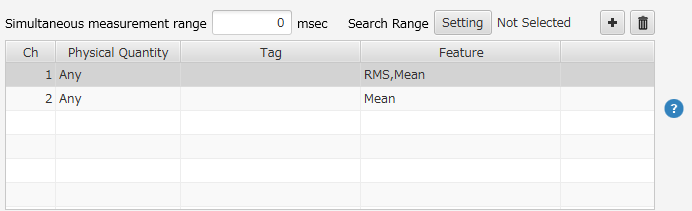
If the measurement date and time of the records are different within the range of this setting, they are regarded as simultaneous measurements. Set this value to 0 if you want to target only exact simultaneous measurements.
Limits the search range of simultaneous measurement records to the specified folder and its sub folders. However, this setting is only applicable when calculating AI model evaluation values from the Calculation of Record Properties Window. For training records and test records in the AI model setting edit window, simultaneous measurement records will be searched from the records registered in each of them.
One row corresponds to one record. Multiple feature values can be specified for each row (each record), and all of them together compose one feature vector. In addition to the preset features, user-defined features can also be selected.
You can set "channel," "physical quantity," and "tag" as conditions for filtering the simultaneous measurement records. Among the records extracted based on the measurement date and time, the records that match the filtering conditions are used as the records that compose the feature vector. To edit each item, click on a cell in the table.
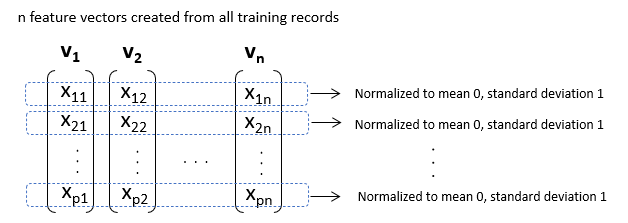
When "Normalize Parameters" is checked, each component of the feature vector will be normalized so that the mean is 0 and the standard deviation is 1 for all the training feature vectors (see the figure below). This is useful when the order of the values for each component is very different, such as when combining different physical quantities to make one feature vector.
Select the training records for making the model. Normally, select the records when the measurement target is considered to be normal, and create a model for the normal conditions. There are two ways to select the training records.
The records stored in the registered folder will be the training records. Multiple folders can be registered. When permorming evaluation by the model, the status of the folder will be checked first, and if the stored records have changed, the model will be recalculated to reflect the latest status.
The calculated evaluation values will not be automatically updated just because the stored records have changed. Also, when using AI model evaluation in the monitoring window, the model will be calculated based on the status of the registered folder at the time the monitoring setting is loaded. Even if there is a change in the records in the registered folder during monitoring, the model will not be automatically updated.
The registered records will become training records.
The display type of the visualization area can be selected from the following two types.
Displays the feature vector of the selected training record(s) or test record(s). Only the case where the feature vector is "frequency spectrum shape" is supported.
In the "Basic Information" tab, you can select "Trained Model", and in the "Model Test" tab, you can select "Model and Test Records". The feature vectors of all training records (and all test records) are plotted on a 3D or 2D chart, and the learned model is displayed as an ellipse contour line. If the dimension of the feature vector is larger than 3, the axis of the dimension with the largest contribution to the upper principal components are automatically selected. The displayed ellipse corresponds to the contour line of the Mahalanobis distance.
Operation by Menu Button
Sets the sensitivity and threshold of the AI model.
Sensitivity is set to "Auto" by default, which means you don't usually need to change it, but you can set it manually. The closer the value is to 100, the more the model is focused on the training data, and the more sensitive it is to abnormal data, but the higher the possibility of overfitting. On the other hand, the closer the value is to 1, the lower the sensitivity to abnormal data, but the higher the generalization performance, and the higher the possibility of properly evaluating unknown data.
The following explanation is for those who understand the Mahalanobis distance, principal components, etc. in the MT method.
The MT system evaluation value in Sigma is calculated by dividing the principal components of the training data into two groups, "main" and "sub", and the more principal components are included in the main group, the higher the sensitivity becomes, but the possibility of overfitting also increases.
Principal components up to a cumulative eigenvalue contribution of 0.95 are included in the main.
Sets the sensitivity between 1 and 100. The higher the value, the more linearly the number of principal components to be included in the main. 1 means that only the first principal component is the main component, while 100 means that all principal components are the main component.
A threshold for an AI model setting is associated with the AI model setting only, and the same setting is applied to all records regardless of the folder where the records are stored or the physical quantity of the records.
How to set the thresholds
Automatically calculated according to the dimension of the feature vector. Assuming that the square of the Mahalanobis distance of the training data follows the χ-square distribution of the degree of freedom d (the number of dimensions of the feature vector), the range where the cumulative probability exceeds 99% is considered as the anomaly level.
Any number can be set.
You can evaluate any record using the model set in Basic Information.
The evaluation here is a function to check whether the model settings are appropriate or not, and the evaluation results are not recorded in Sigma. If you want to record the evaluation results as record properties in Sigma and display the trend, etc., register the AI model setting as record paroperty in the AI Model Settings List window, and perform the calculation from the Record Property Calculation window.
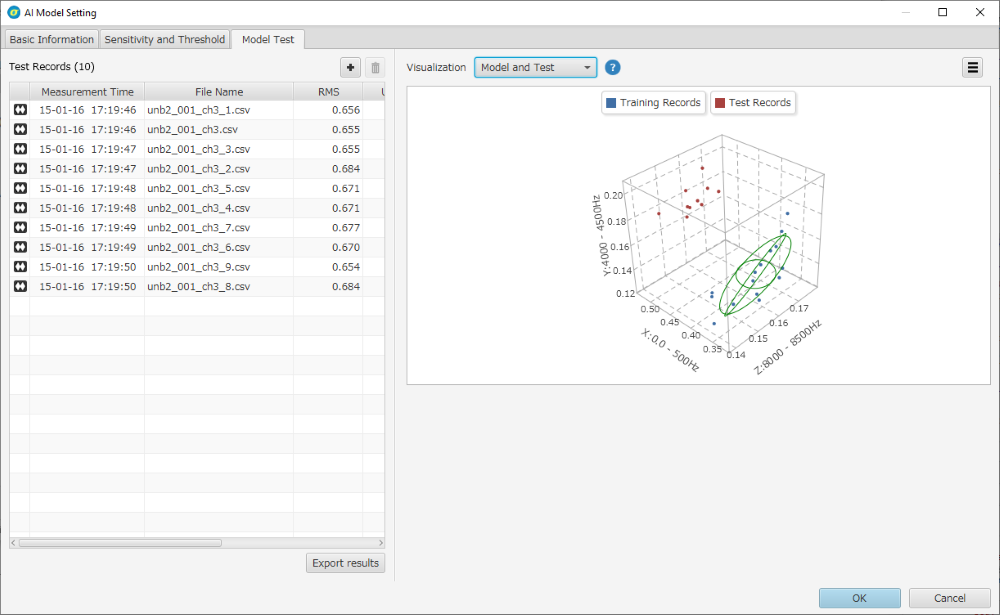
Click the Add Test Records button to add the record you want to evaluate.
Evaluate the test records using the AI model set in the "Basic Information" and "Sensitivity and Threshold" tabs, and output the results to CSV. Enter a file name in the dialog box that opens after clicking the "Export Results" button, and click the "Save" button to output the evaluation results to CSV. The rightmost column of the CSV is the evaluated value by the model.
It is the same as the visualization area in "Basic Information", but if you select "Model and Test Records" as the visualization type, all the test records will be plotted in 2D or 3D space in addition to all the training records and the learned model (Mahalanobis distance contours).
In order to evaluate any records in Sigma using the AI model settings, the AI model settings need to be registered to Record Property. For details on how to register AI model settings to Record Property, please refer to "Registration to Record Property".
To perform evaluation using AI model settings registered to Record Property,
push calc button  and select "Calculate Record Properties".
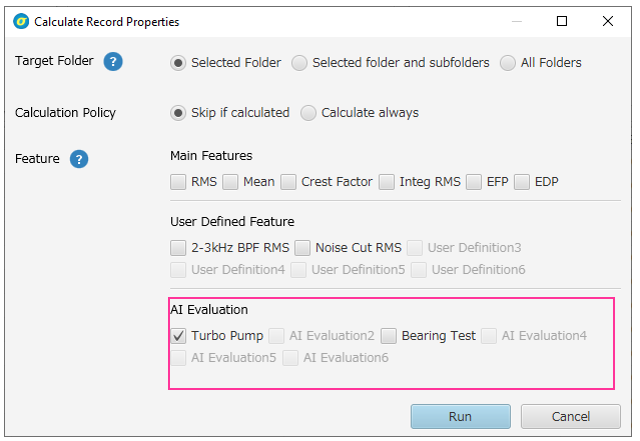
You can calculate evaluations using AI models in the same way as for preset features and user-defined features. For more details on the Calculate Record Properties window, please refer to "Calculate record properties".
The calculated evaluation results are recorded as record properties and can be viewed in the record list of the main screen.
If the column of evaluation results by AI model is not displayed, right-click in the record list table and select "View Settings", then check the column name you want to display.
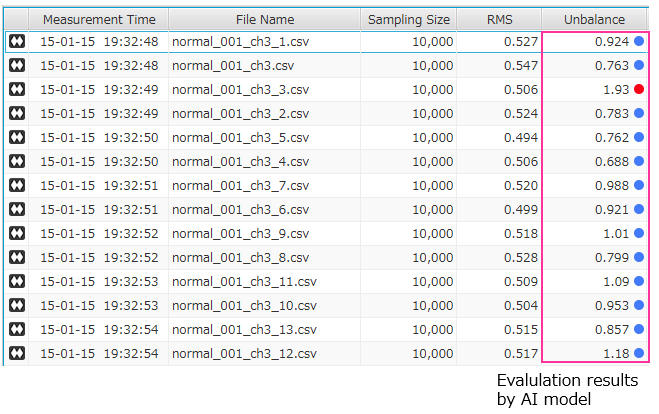
In the case of the setting to create one feature vector from multiple records measured simultaneously, the same result value will be recorded in all records that constitute the feature vector to be evaluated.
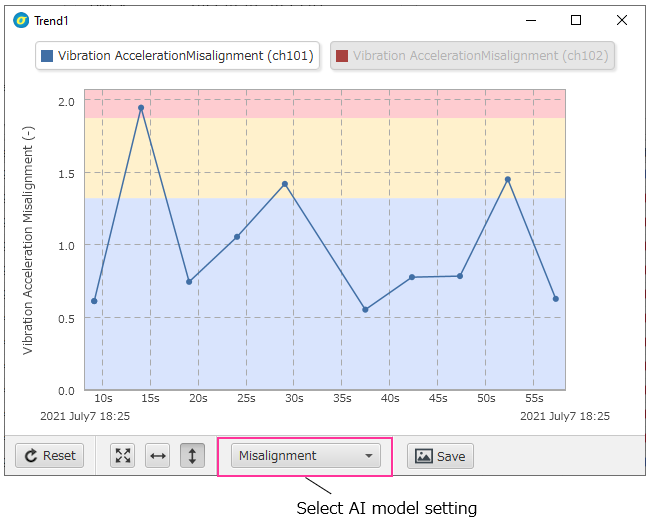
The evaluation results recorded in the record properties can be displayed as a trend in the same way as
the preset and user-defined features of the record.
With the folder containing the record you want to display as a trend selected,
click the Trend button in the toolbar,
and select "Trend of records", and select the AI model setting you want to display in the feature selection choice box at the bottom of the trend view window.
For details on the trend function, see Trend View.
in the toolbar,
and select "Trend of records", and select the AI model setting you want to display in the feature selection choice box at the bottom of the trend view window.
For details on the trend function, see Trend View.
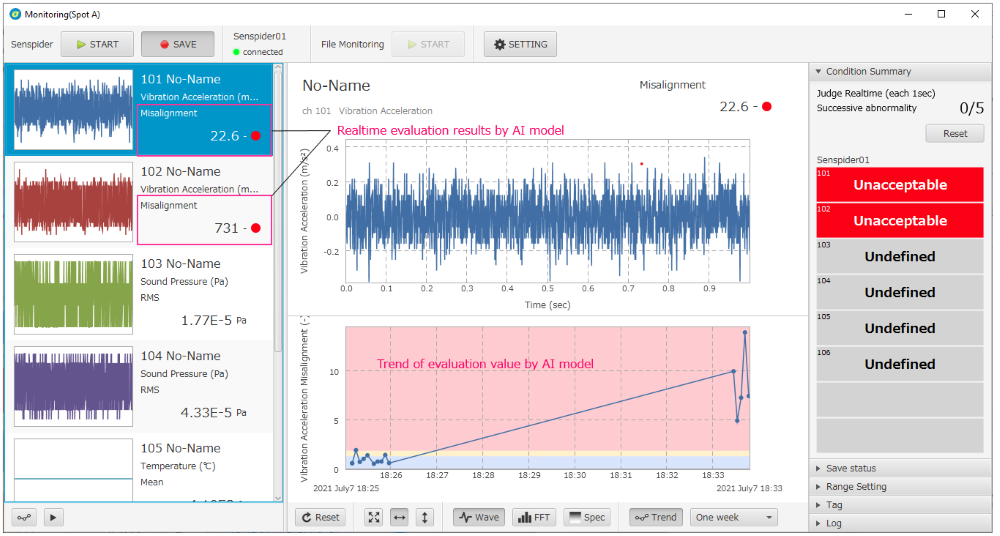
In the monitoring window, you can perform real-time evaluation and threshold judgment using the AI model.
To use the monitoring function, Senspider module or File monitoring module is required.
To perform real-time evaluation using AI models, specify the AI model setting you want to apply to the main features of the channel. The AI model can be applied not only to Senspider channels but also to file monitoring channels.
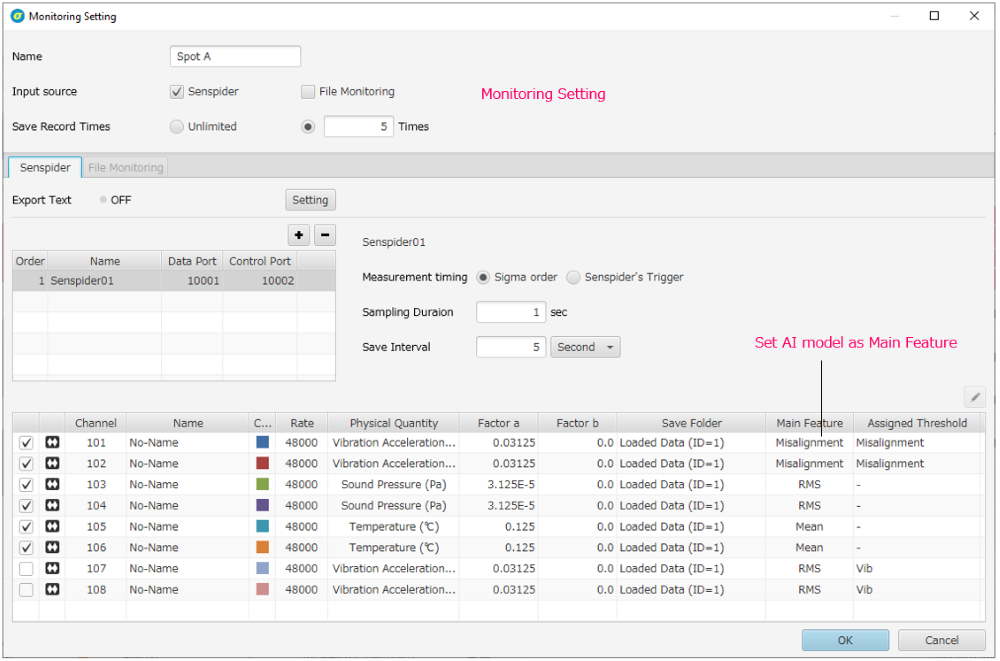
When monitoring is started, the evaluation result by the AI model is displayed in real time, and the judgment result according to the threshold value is displayed. In the trend view area, the trend of the AI model evaluation value is displayed. (only when the data is saved as a record). For more details on the monitoring function, please refer to Monitoring.