 on the toolbar.
The feature values calculated here will be saved in Sigma as properties of the records, and can be displayed in the record list
and the trend view.
on the toolbar.
The feature values calculated here will be saved in Sigma as properties of the records, and can be displayed in the record list
and the trend view.
In Sigma, a single scalar value such as "mean" or "RMS" calculated from a raw waveform is called the "feature value".
To calculate the feature values of records at once,
select "Calculate Record Properties" from the calc button on the toolbar.
The feature values calculated here will be saved in Sigma as properties of the records, and can be displayed in the record list
and the trend view.
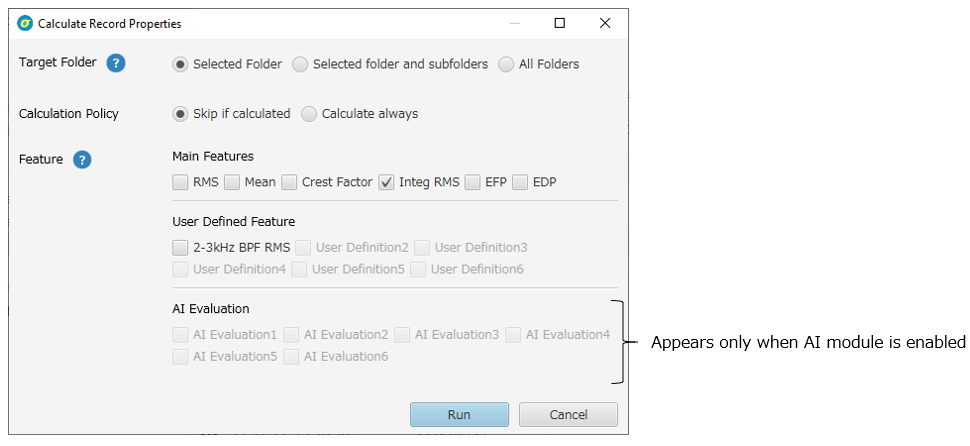
Calculates the records stored in the currently selected folder.
All records stored in the currently selected folder and all folders under the selected folder will be calculated.
Calculates the records stored in all folders (all records).
Features that have already been calculated will not be recalculated.
Features that have already been calculated will be recalculated.
The root mean square of a signal. * Sigma always calculates the RMS after centering the signal so that the mean value becomes zero, so it is identical to the standard deviation.
The mean value of the signal.
The ratio of the maximum value to the RMS.
When this feature is calculated for vibration acceleration (m/s2), the RMS of vibration velocity (mm/s) is obtained, and the ISO standard can be applied to this value.
The detail of the process is as follows.
10-1000Hz band-pass filter -> Integration -> RMS -> x1000
The sampling rate of 2000 Hz or higher is required for the calculation.
An abnormality indicator for bearings that rotate at high speed.
Sampling rate of 8000 Hz or higher is required for the calculati
An abnormality indicator for bearings that rotate at low speed.
The following conditions are required for the calculation.
(1) EM sensor signal
(2) Bearing is set as the object type for the folder where the record stored.
(3) RPM is set for the record.
For details on how to set the object type, please refer to Folder Settings.
User-defined features that have been registered as record property can be calculated from this window. Up to six user-defined features can be registered as record property. For details, please refer to User Defined Features.
The evaluation values of AI model settings that are registered as record property can be calculated. Up to six AI model settings can be registered as record property. For more details, please see Creating AI Model Settings.
You can define calculation procedures for time series signals (raw waveforms) and create your own features.
To manage user-defined features, select "User Defined Feature" from the Setting button  on the toolbar
to open the User Defined Features Management window.
on the toolbar
to open the User Defined Features Management window.
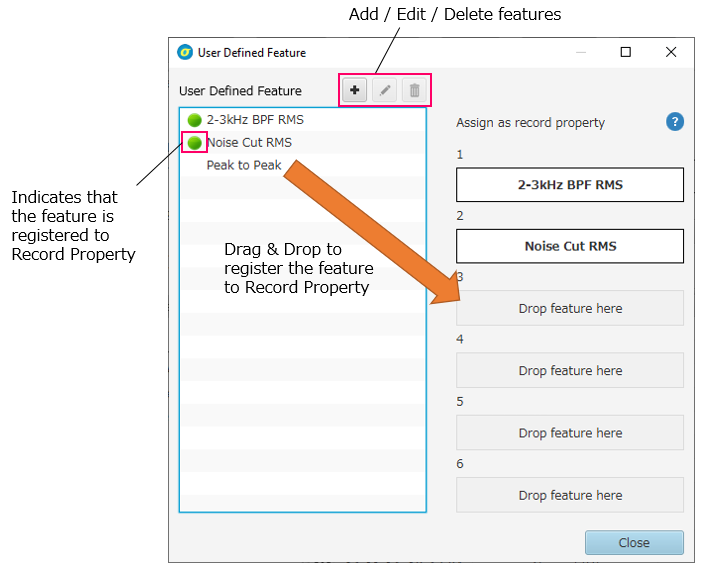
Click the Add button or the Edit button to open the User Defined Feature Edit window. For details, see How to Define Features.
By registering user-defined features to "Record Property", the calculation results of the features can be saved in Sigma as information attached to each record, and can be displayed in trend charts and threshold judgment can be applied. There are six record property slots, which are global settings for all records. To calculate features registered to record property, see Calculate record property.
To calculate user-defined features without registering them to record properties,
select "Calculate user feature" from the Calc button
on the toolbar. The calculation result will be output to CSV and will not be saved in Sigma.
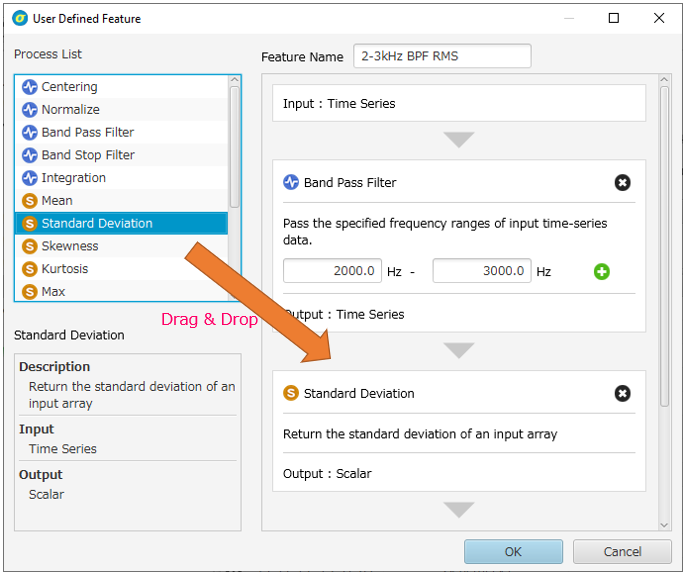
Click the Add or Edit button in the User Defined Feature Management window to open the User Defined Feature Edit window. Features are defined by arranging the basic calculation processes in order. The figure below shows an example of calculating RMS for a specific frequency range (3kHz-10kHz).
 Signal processing
Receives a time series signal as an input and outputs a time series signal. (e.g. bandpass filter)
 Statistical value
Receives a time series signal as an input and outputs a scalar value. (Mean, etc.)
 Basic operations
Outputs a time series signal if the input is a time series signal, or outputs a scalar value if the input is a scalar value. (Constant multiplication, etc.)
There are two ways to calculate user-defined features.
User-defined features registered to record property can be calculated from the Record Properties Calculation window. The calculation results are saved in Sigma as record properties, and the results can be displayed in trend charts.
Calculation results are output to CSV and are not saved in Sigma.
Select "Calculate User Feature" from the Calc button
on the toolbar to open the User Feature Calculation window.
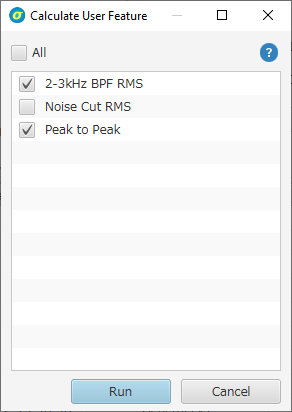
The calculation targets are the records displayed in the table on the main screen. If the records are filtered, only the displayed records will be calculated.
Check the features you want to calculate, and click the Run button. A dialog box will appear to specify the location and file name of the CSV file to be output. The calculation results will be output to the CSV file.
The output format will be the table contents displayed on the main screen with the calculation result columns added.
Displays the trend of feature values for all records displayed or only selected ones in the record list,
with the measurement time as the horizontal axis.
To display the trend, click the Trend button  on the toolbar
and select "Trend of records" or "Trend of selected records".
on the toolbar
and select "Trend of records" or "Trend of selected records".
By default, records with the same physical quantity and the same channel are considered as one series. If you want to ignore the channel differences (if you want to distinguish series only by physical quantities), right-click on the trend view and select "Integrate Channels" from the context menu.
When the message "No Data" is displayed
Check that the feature values selected in the selection box
have been calculated for the records for which you want to display the trend.
To calculate the feature values for a record, see Calculate record property.
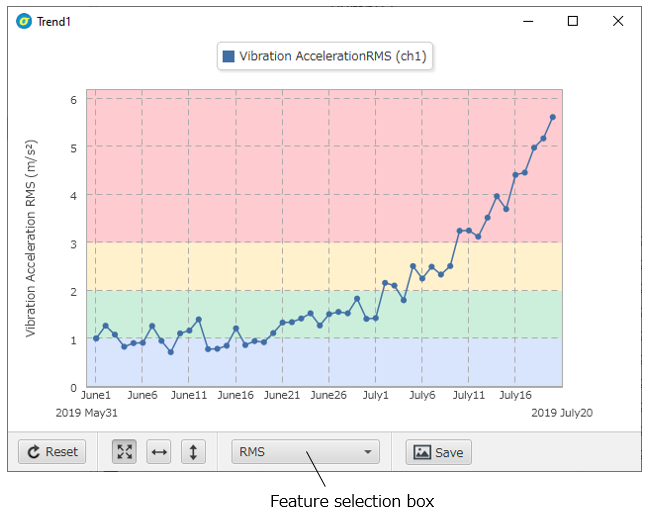
Select a feature from the feature selection box.
When the cursor is close to a point on the trend, the point will be highlighted. Clicking the mouse in this state selects the record corresponding to the point in the record list of the main screen. Note that this behavior does not occur when the record list is displaying records from a different folder than the currently displayed trend.
When the cursor is placed near a point, double-click to show the raw waveform of the corresponding record.
The operations of the graph area and other buttons are the same as Signal view operations.
Displays a line chart of the feature values for all records or selected ones in the record list.
In contrast to the trend chart, which uses the measurement time of each record as the horizontal axis,
the line chart uses the order of the records in the record list as the horizontal axis value.
To display a line chart, click the Trend button
and select "Line chart of records" or "Line chart of selected records".
In the line chart, the display order in the record list is reflected as it is. By using the sort function by clicking on the item name in the column of the record list, you can display the line chart sorted by any item. The operations in the Line chart view are the same as in the Trend view.
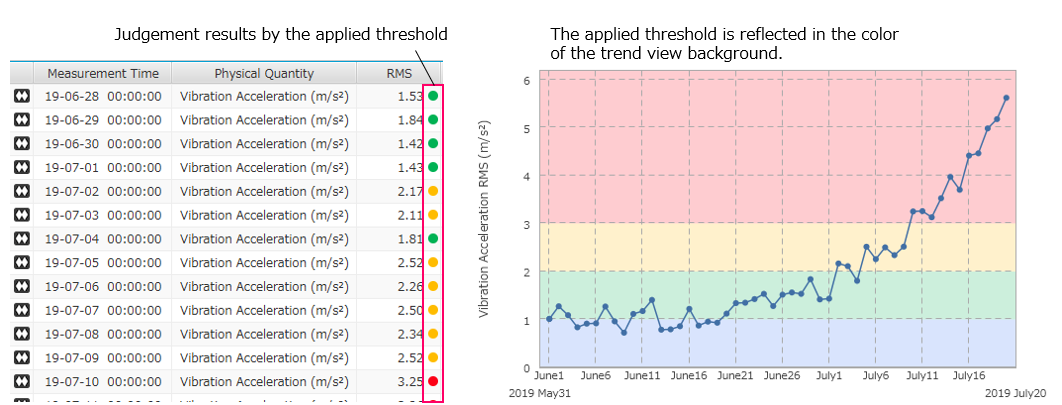
In Sigma, thresholds can be applied to signal features. When a threshold is applied, the judgment result is displayed in color in the corresponding feature column in the record list, and the background color in the trend view reflects the threshold setting.
When two physical quantities are displayed in a trend view, the threshold setting applied to the physical quantity on the left axis is always used for the background color. If you want to use the threshold setting applied to the physical quantity on the right axis, right-click on the trend view and select "Chart View Setting" and switch the vertical axis.
Thresholds are applied to folders (or link lists). By applying a threshold to a folder, all records in that folder will be judged according to the applied threshold.
The exception is the threshold for "AI model evaluation values". See Threshold for details.
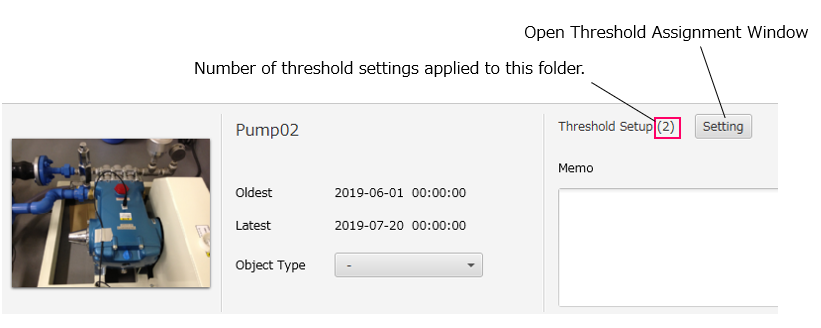
To apply a threshold to a folder, click the "Setting" button in the Folder Details Area to open the "Threshold Assignment Window".
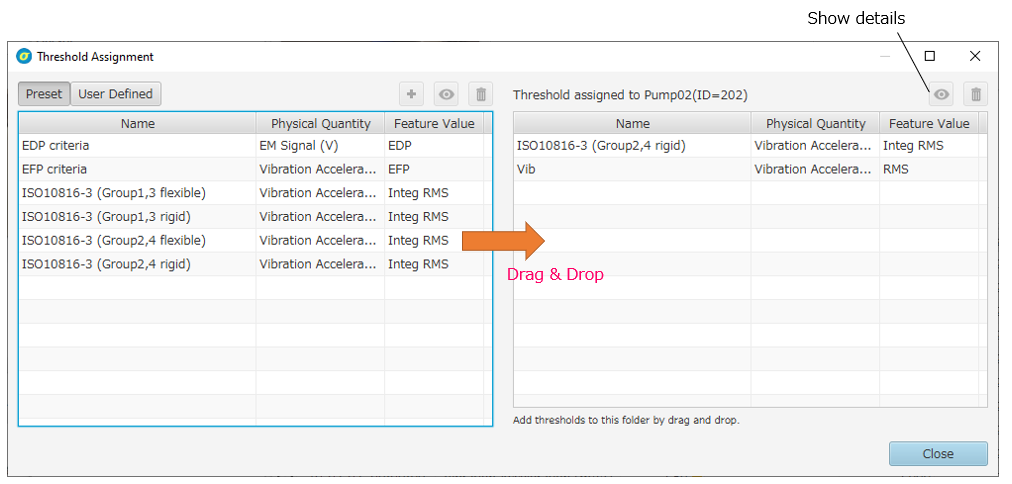
The Threshold Assignment Window consists of two tables.
The left table shows all the threshold settings registered in Sigma.
The left table is the same as the one displayed in the Threshold Definition Window.
(See Define Thresholds for details.)
The table on the right shows a list of thresholds that are currently applied to this folder.
To apply a threshold to this folder, drag and drop the threshold setting from the left table to the right table.
To remove the applied threshold, select the threshold setting you want to remove and
press the Remove button  .
.
Multiple threshold settings can be applied to a single folder. However, multiple threshold settings cannot be applied to the same combination of target physical quantity and feature.
To define thresholds, select "Threshold Definition" from the Setting button
on the toolbar to open the Threshold Definition View.
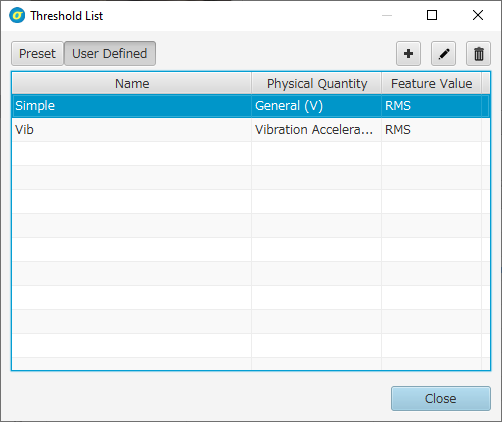
Click the Add button or the Edit button to open the Threshold Edit View.
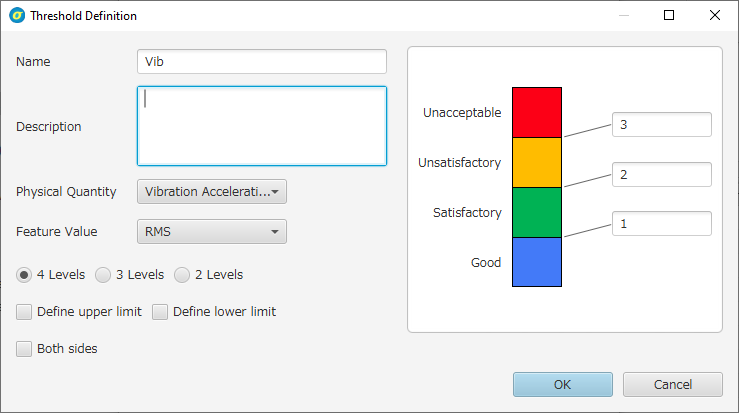
To define a threshold setting, specify the target physical quantity and target feature, and the boundary level for each judgment.